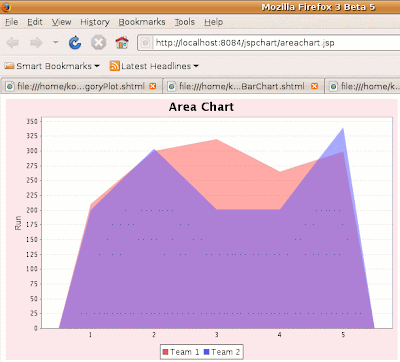
This Example shows you how to create a area chart in JSP page using JFreeChart. Code given below creates a area chart of runs of two teams in different matches. In the code given below we have extended class ApplicationFrame to create a frame and also pass a string value to the constructor of ApplicationFrame class by using super keyword that will be name of the created frame.
jspareachart.jsp
<%@page contentType="text/html" pageEncoding="UTF-8"%>
<!DOCTYPE HTML PUBLIC "-//W3C//DTD HTML 4.01 Transitional//EN"
"http://www.w3.org/TR/html4/loose.dtd">
<%@ page import="java.awt.*" %>
<%@ page import="java.io.*" %>
<%@ page import="org.jfree.chart.*" %>
<%@ page import="org.jfree.chart.axis.*" %>
<%@ page import="org.jfree.chart.entity.*" %>
<%@ page import="org.jfree.chart.labels.*" %>
<%@ page import="org.jfree.chart.plot.*" %>
<%@ page import="org.jfree.chart.renderer.category.*" %>
<%@ page import="org.jfree.chart.urls.*" %>
<%@ page import="org.jfree.data.category.*" %>
<%@ page import="org.jfree.data.general.*" %>
<%
final double[][] data = new double[][]{
{210, 300, 320, 265, 299},
{200, 304, 201, 201, 340}
};
final CategoryDataset dataset =
DatasetUtilities.createCategoryDataset(
"Team ", "", data);
final JFreeChart chart = ChartFactory.createAreaChart(
"Area Chart", "", "Value", dataset,
PlotOrientation.VERTICAL,
true, true, false);
final CategoryPlot plot = chart.getCategoryPlot();
plot.setForegroundAlpha(0.5f);
chart.setBackgroundPaint(new Color(249, 231, 236));
try {
final ChartRenderingInfo info = new ChartRenderingInfo
(new StandardEntityCollection());
final File file1 = new File("../webapps/jspchart/web/
areachart.png");
ChartUtilities.saveChartAsPNG(file1, chart, 600, 400, info);
} catch (Exception e) {
out.println(e);
}
%>
<html>
<head>
<meta http-equiv="Content-Type" content="text/html; charset=UTF-8">
<title>JSP Page</title>
</head>
<body>
<IMG SRC="areachart.png" WIDTH="600" HEIGHT="400" BORDER="0"
USEMAP="#chart">
</body>
</html>
Methods used in this example are described below:
pack(): This method invokes the layout manager.
centerFrameOnScreen(): This method is used for the position of the frame in the middle of the screen.
setVisible(): This method is used for display frame on the screen.
createCategoryDataset(): This method is used to create the instance of CategoryDataset Interface and that contains a copy of the data in an array.
createAreaChart(): This method is used to create bar chart for given values. It takes title, category axis label, value axis label, dataset, Plot Orientation, legend, tool tips and urls as parameters.
Output:

